Looking for a new background for your computer, tablet, or phone? Or just looking to make a cool visual of a place that you like? We can make an awesome “ridge plot” of a location using an elevation map, all in Python.
The Jupyter notebook in which this visualization is made can be found here, although commits after this post may change the most updated version of the code.
Before we get started, you’ll need these two non-standard Python packages:
- ridge_map: https://github.com/ColCarroll/ridge_map
- srtm.py: https://github.com/tkrajina/srtm.py
srtm.py is a Python parser for the Shuttle Radar Topography Mission, and ridge_map is the library that we will be relying upon to make the ridge plots.
Import the standard modules:
import numpy as np
import matplotlib.pyplot as plt
import matplotlib
import matplotlib.colors as colors
Import the additional modules (from the path that I use):
import sys
sys.path.append('../../../python_pkgs/ridge_map/ridge_map/')
sys.path.append('../../../python_pkgs/srtm/')
from ridge_map import *
Now select the bounding box of the area you would like to plot. One useful resource to do this is bboxfinder, but you could also use Google Maps or Google Earth as well. Here I select a box that bounds a region in northern Ethiopia where I performed some of my Ph.D. research in:
rm = RidgeMap((39.105148,13.030649,39.379807,13.205855))
Making the ridge plot is straight forward using the ridge_map package. Rather than re-writing the documentation on how to customize your own ridge plot, I refer you to the detailed read me of the ridge_map package.
bgcolor = '#222222'
values = rm.get_elevation_data(num_lines=150)

ridges = rm.plot_map(values=rm.preprocess(values=values,
                                          lake_flatness=0,
                                          water_ntile=0,
                                          vertical_ratio=400),
                     label='',
                     kind='elevation',
                     linewidth=1,
                     background_color=bgcolor,
                     line_color = plt.get_cmap('plasma'))

plt.savefig('Samre-ridge-map.jpg', dpi=300, bbox_inches='tight')
The result:
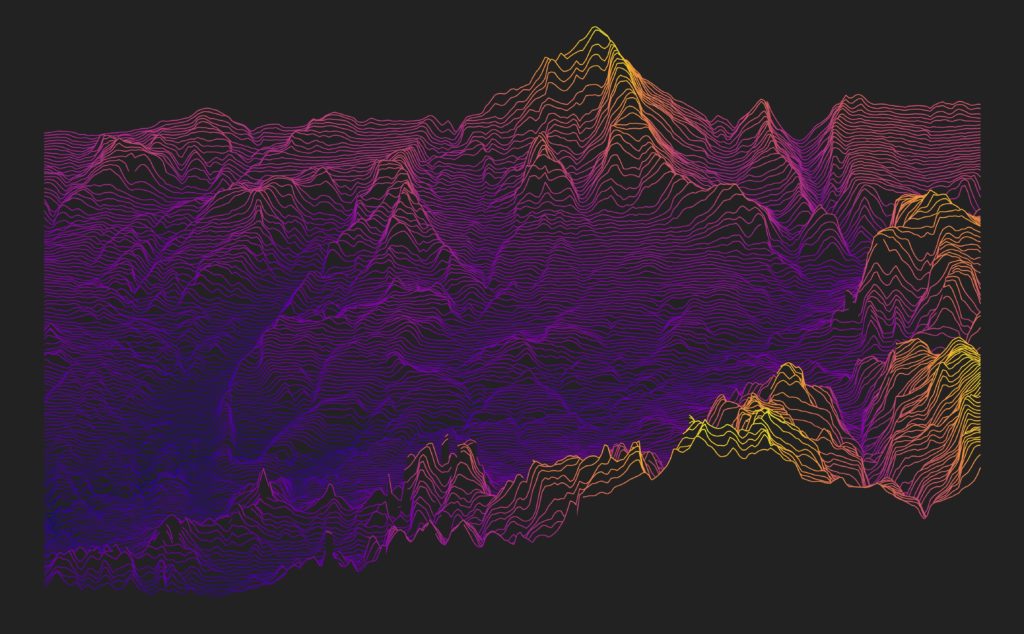
Versus what the area looks like in satellite imagery:
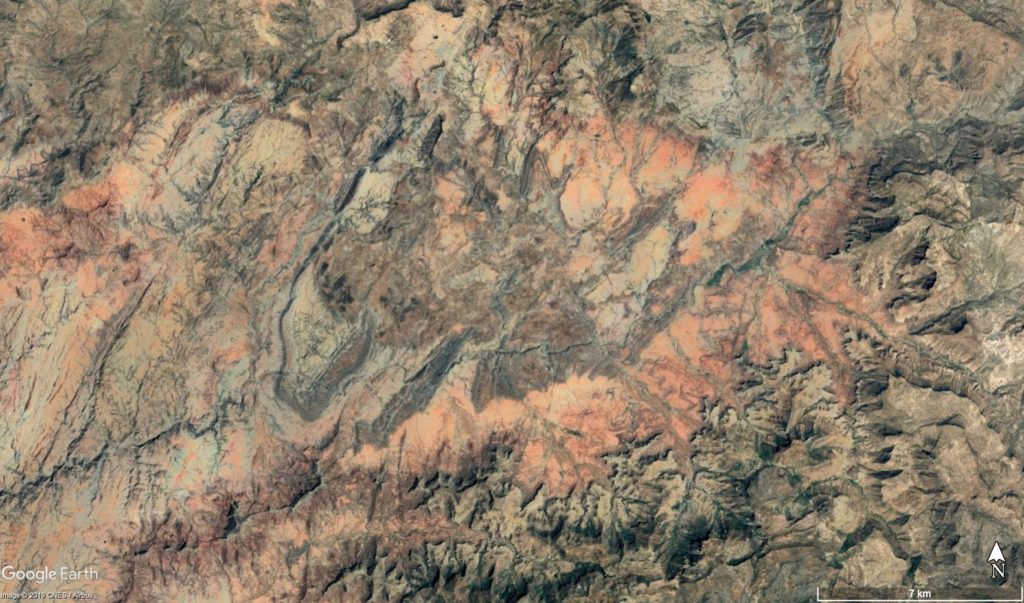
Many of the different colours that you see in the satellite imagery are actually different types of rocks. For example, in the SW quadrant of the image, you can see this U-shaped strip of black. This strip is limestone, and you can see that it makes a distinct topographic high in the ridge plot!