Park, Y., Swanson-Hysell, N. L., Macdonald, F. A., Lisiecki, L. E., 2021, Evaluating the relationship between large igneous province area and Earth’s long-term climate state: AGU Geophysical Monograph Series 255 – Large Igneous Provinces: A Driver of Global Environmental and Biotic Changes, doi:10.1002/9781119507444.ch7.
Macdonald, F. A., Swanson-Hysell, N. L., Park, Y., Lisiecki, L. E., Jagoutz, O., 2019, Arc-continent collisions in the tropics set Earth’s climate state: Science, vol. 364, pp. 181–184, doi:10.1126/science.aav5300.
On multimillion-year time scales, Earth has experienced warm ice-free and cold glacial climates, but it is unknown whether transitions between these background climate states were the result of changes in carbon dioxide sources or sinks. Low-latitude arc-continent collisions are hypothesized to drive cooling by exhuming and eroding mafic and ultramafic rocks in the warm, wet tropics, thereby increasing Earth’s potential to sequester carbon through chemical weathering. Similarly, the chemical weathering of large igneous provinces (LIPs) are also hypothesized to drive cooling, although importantly LIPs tend to erupt onto stable continental interiors or into subsiding sedimentary basins during rifting, and are therefore not actively exhumed.
To better constrain global weatherability through time, the paleogeographic positions of all major Phanerozoic arc-continent collisions (Fig. 1) and LIPs (Fig. 2) were reconstructed and compared to the latitudinal distribution of ice sheets. This analysis reveals a strong correlation between the extent of glaciation and arc-continent collisions in the tropics (Fig. 3). These results suggest that Earth’s climate state is set primarily by global weatherability, which changes with the latitudinal distribution of arc-continent collisions. On the other hand, we find no significant correlation between LIP area in the tropics and the extent of continental ice sheets (Fig. 4). These results suggest that changes in planetary weatherability associated with LIPs are not the fundamental control on whether Earth is in a glacial or nonglacial climate, although they could provide a secondary modulating effect in conjunction with other processes.
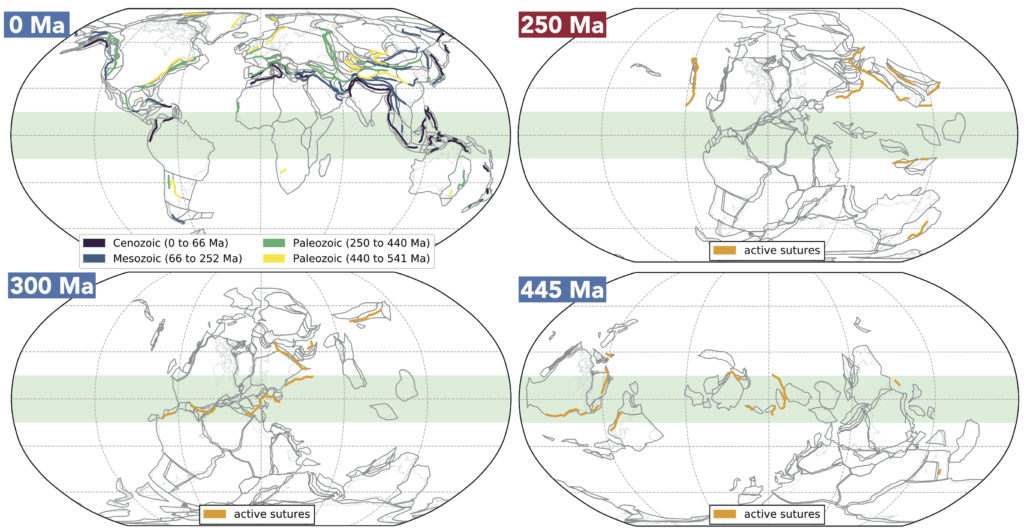
Figure 1: Reconstructions of ophiolite-bearing sutures. All sutures within the compilation are shown in present-day coordinates in the 0 Ma map and are color-coded by age. The tropical rain belt is shaded green. Paleogeographic reconstructions of these tectonic units and actively exhuming sutures are shown at the times of peaks in total suture length (Fig. 2). The Triassic (250 Ma) peak in total suture length is at a nonglacial interval (red) with minimal suture length in the tropics. The Carboniferous (300 Ma) and Ordovician (445 Ma) peaks are both during glacial intervals (blue) and have extensive suture length in the tropics.
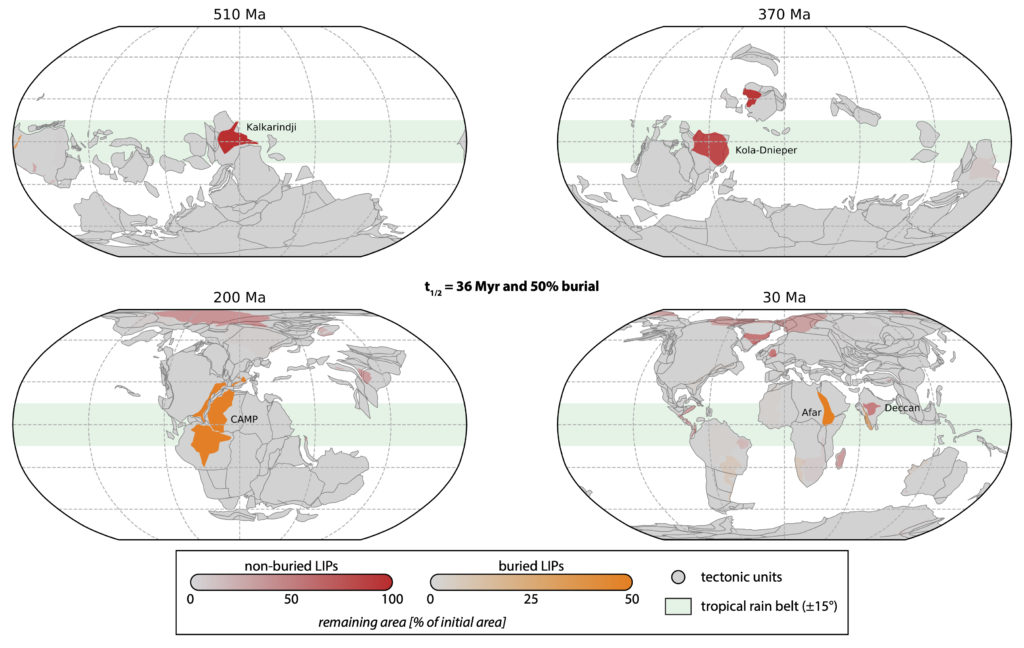
Figure 2: Paleogeographic reconstructions for times that correspond to peaks of LIP area in the tropics. The opacity of LIP polygons indicates their parameterized remaining area at the time of the reconstruction as a percentage of initial LIP area, under the preferred post-emplacement scenario of t1/2 = 36 Myr + 50% burial.
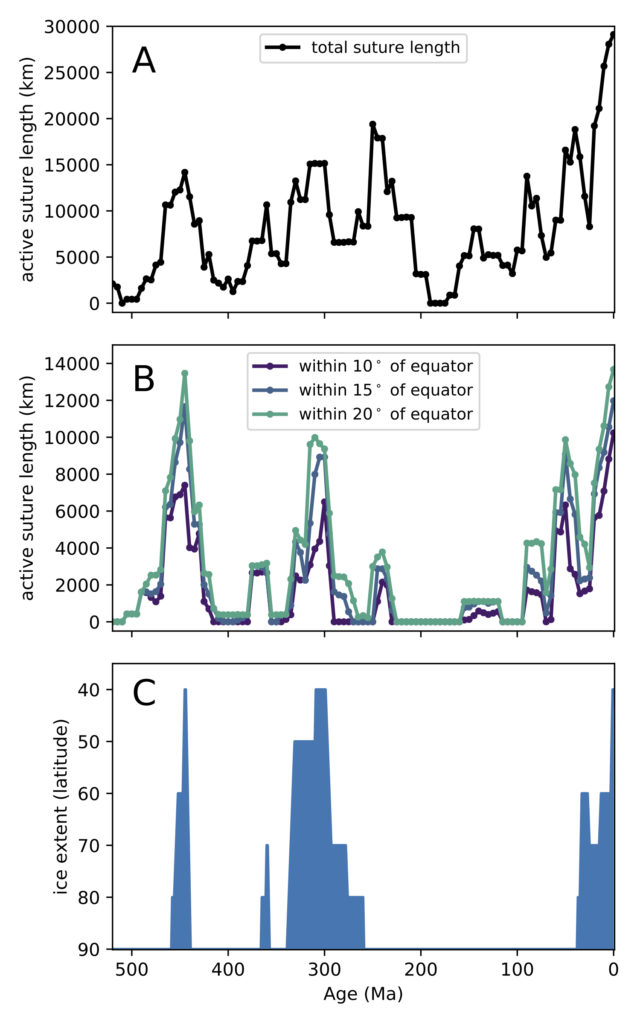
Figure 3: Phanerozoic suture length in the tropics compared to the latitudinal extent of continental glaciation. (A) Total length of active suture length. (B) Total length of active sutures that are reconstructed to be within 10°, 15°, and 20° of the equator over the past 520 million years. (C) Blue marks the latitudinal extent of continental ice sheets, excluding Alpine glaciers (table S3).
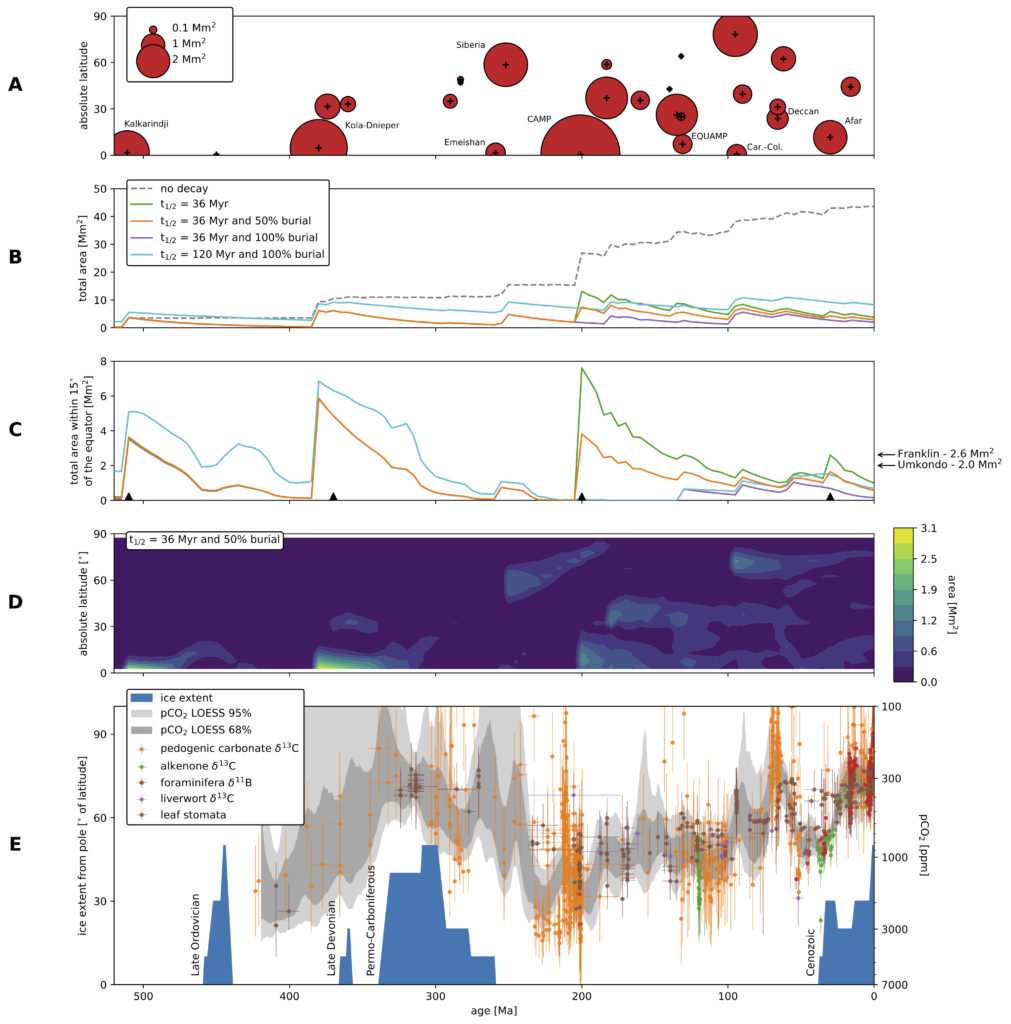
Figure 4: (A) LIPs included in this analysis. The size of each circle reflects the initial surface area estimate of each LIP. The + indicates the timing and absolute paleolatitude of the centroid of each LIP at the time of emplacement. Car.-Col. = Caribbean-Colombian. (B) Total LIP area through time for the different post-emplacement scenarios. Only the “no decay’ scenario excludes pre-Phanerozoic LIPs. (C) Tropical LIP area through time for the different post-emplacement scenarios. The arrows to the right indicate reconstructed tropical LIP area at the time of emplacement for the ca. 720 and 1,109 Ma Franklin and Umkondo LIPs. The triangles show the paleogeographic reconstruction times in Figure 2. (D) Contour plot showing the latitudinal distribution of LIP area for one of the post-emplacement models. (E) Latitudinal extent of land ice away from the poles and compilation of pCO2 proxies (pCO2y-axis reversed, and in log-scale). Error bars indicate standardized uncertainties, and grey bands indicate 68% and 95% confidence intervals for Monte Carlo resampled LOESS fits to the pCO2 proxy data. Note that there are pCO2 proxy estimates <100 ppm that are cut off in this plot.