Related publications:
- Park, Y., Maffre, P., Goddéris, Y., Macdonald, F. A., Anttila, E. S. C., Swanson-Hysell, N. L., 2020, Emergence of the Southeast Asian islands as a driver for Neogene cooling: Proceedings of the National Academy of Sciences, vol. TBD, pp. TBD, doi:10.1073/pnas.2011033117.
- Park, Y., Maffre, P., Goddéris, Y., Macdonald, F. A., Anttila, E. S. C., Swanson-Hysell, N. L., 2021, Reply to Rugenstein et al.: Marine Sr and Os records do not preclude Neogene cooling through emergence of the Southeast Asian islands, vol. TBD, pp. TBD, doi:10.1073/pnas.2107556118.
Related code:
Summary:
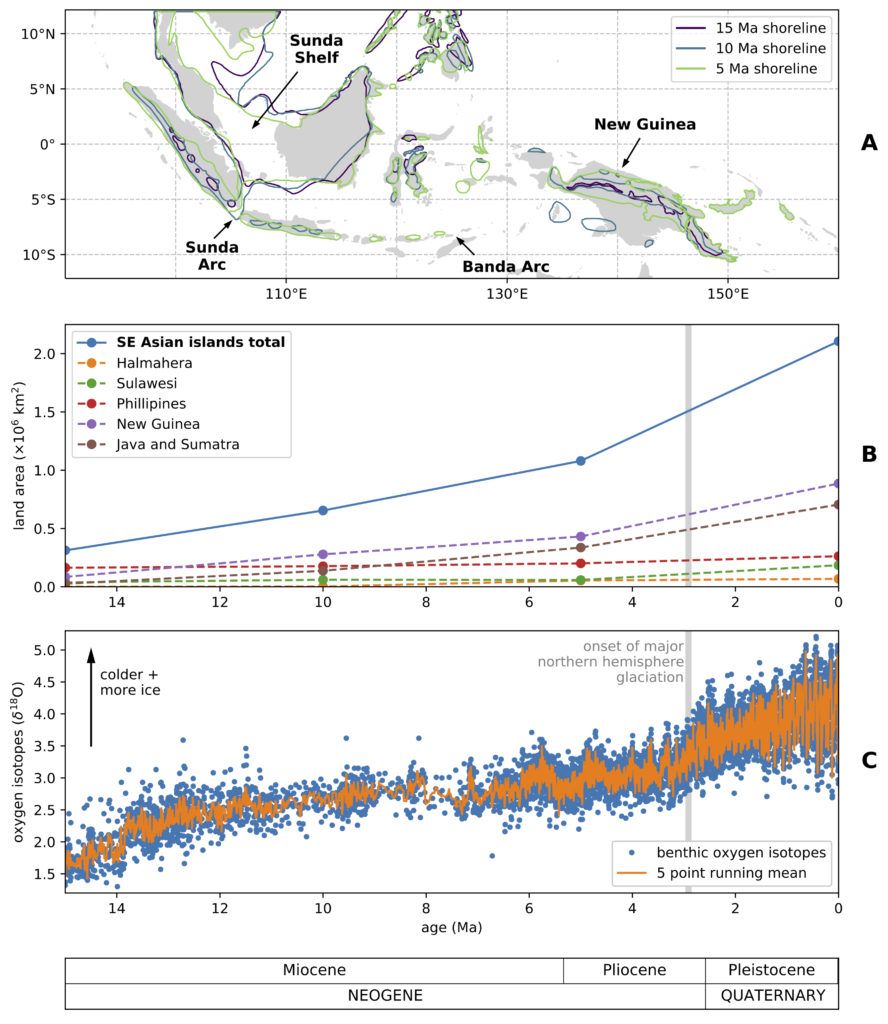
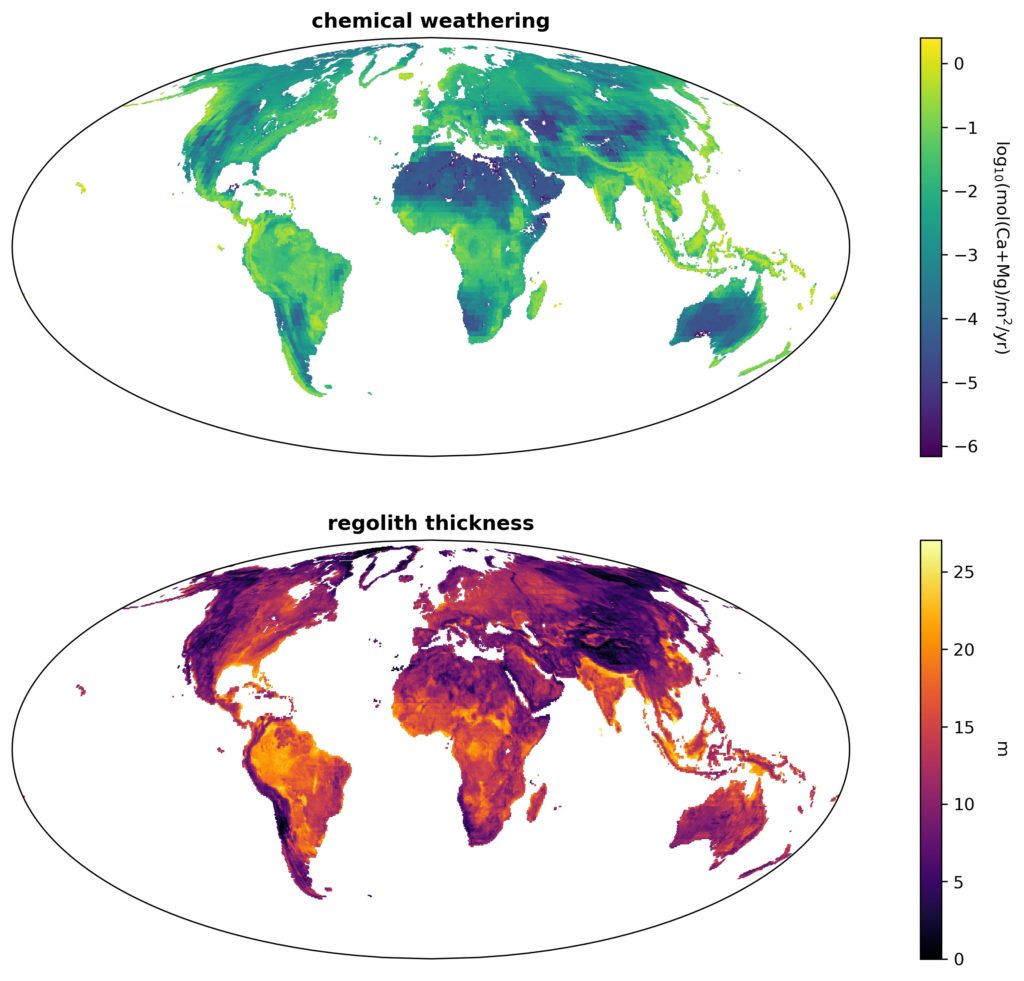
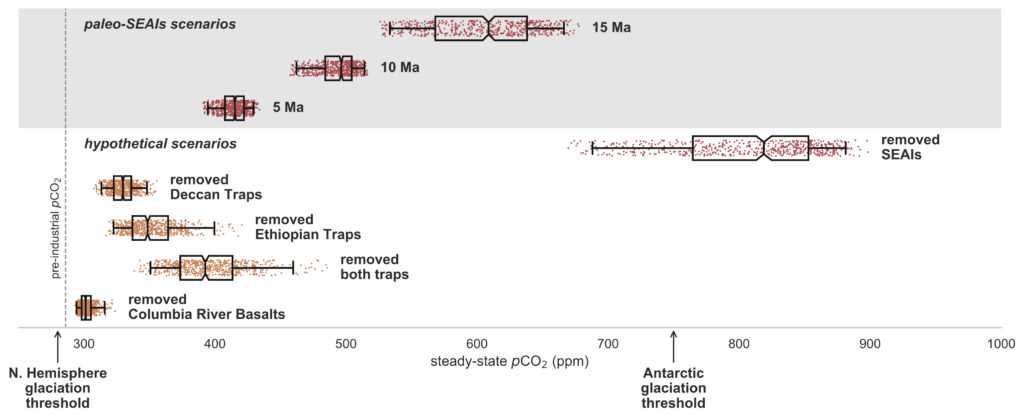
Steep topography, a tropical climate, and mafic lithologies contribute to efficient chemical weathering and carbon sequestration in the Southeast Asian islands (SEAIs). Ongoing arc-continent collision between the Sunda-Banda arc system and Australia has increased the area of subaerially exposed land in the region since the mid-Miocene (Fig. 1). Concurrently, Earth’s climate has cooled since the Miocene Climatic Optimum, leading to growth of the Antarctic ice sheet and the onset of Northern Hemisphere glaciation (Fig. 1). We seek to evaluate the hypothesis that the emergence of the SEAIs played a significant role in driving this cooling trend through increasing global weatherability. To do so, we have compiled paleoshoreline data and incorporated them into GEOCLIM, which couples a global climate model to a silicate weathering model with spatially resolved lithology (Fig. 2). We find that without the increase in area of the SEAIs over the Neogene, atmospheric pCO2 would have been significantly higher than pre-industrial values, remaining above the levels necessary for initiating Northern Hemisphere ice sheets (Fig. 3).